The ALMA Site
A world-class observatory in the desert
The ALMA Observatory is operated at two distinct sites, far away from comfortable living conditions of modern civilization.
The ALMA antennas are located at the Array Operations Site (AOS) on the Chajnantor plateau of the Chilean Andes at an altitude of 5000 meters, about 40 km east of the village of San Pedro de Atacama. Measurements since 1995 have demonstrated the existence of exceptional atmospheric conditions at this site for observations at millimeter and submillimeter wavelengths, i. e., transparency and stability.
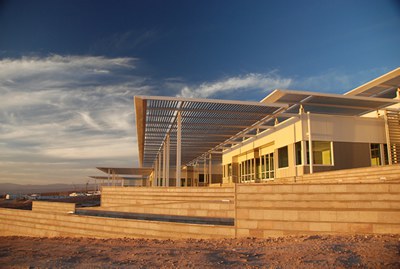
The ALMA Operations Support Facility (OSF) is the base camp for the every-day, routine operation of the observatory. It is located at an altitude of about 2900 meters, quite high compared to standard living conditions, but still quite acceptable for scientific projects in astronomy of similar scope. However, the OSF does not only serve as the location for operating the Joint ALMA Observatory, it is also the Assembly, Integration and Verification (AIV) station for all the high technology equipment before being moved to the AOS.
The geographical location of ALMA is
latitude: -23.029° ; longitude: -67.755°
The Operations Support Facility (OSF)

The OSF is, in many aspects, the center of activities of the ALMA project. The OSF is the focal point of all antenna Assembly-Integration-Verification (AIV) activities. Antenna assembly is done at the OSF site at three separate areas, one each for the antennas provided by North America (VERTEX), Japan (MELCO), and Europe (AEM Consortium).
The OSF is also the center for activities associated with the extension and optimization of ALMA capabilities as well as Principal Investigator (PI) Science observations. During the operations phase of the observatory it is the workplace of the astronomers and of the teams responsible for maintaining proper functioning of all the telescopes.
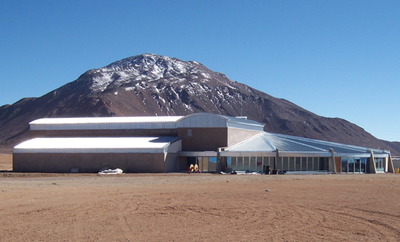
The Array Operations Site (AOS): The second highest building in the world

The construction of the AOS Technical Building started in October 2005 and the outer shell was completed by mid 2006. Inside construction work was completed in summer 2007. Human operations at the AOS is limited to an absolute minimum, due to the high altitude. The AOS Technical Building houses the ALMA Correlator . Digitized signals received from the radio telescopes are processed here and further transmitted to the data storage facilities located at the OSF.
A High Altitude Road with Super-Highway Dimensions
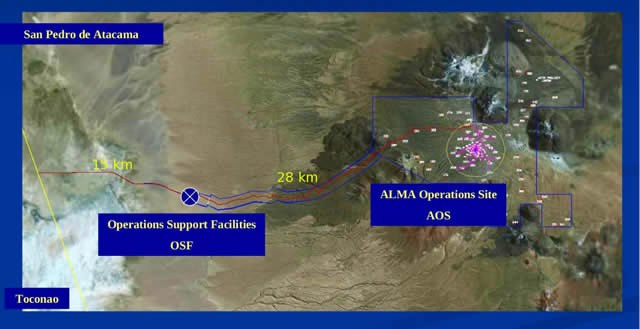
The construction of the OSF and AOS sites and their access required substantial efforts of the ALMA project. Obviously, there was no access to these two remote locations (see Figure below). The OSF site, located at 2900 meters altitude, is about 15 kilometers away from the closest public road, the Chilean highway No. 23. The AOS is another 28 kilometers away from the OSF site. Thus, one of the first projects to be accomplished by ALMA was to construct an access road not only to the OSF but also to the AOS road, 43 km in length, not only at high altitudes, but also with sufficient width to regularly transport a large number of large radio telescopes with a diameter of 12 meters.

General Weather Statistics
The meteorological conditions on Chajnantor have been monitoried since April 1995. In the period 1995-2004, the data was collected using the NRAO and ESO weather stations and since 2004 similar data has been collected at the weather station at the Atacama Pathfinder EXperiment (APEX). The former data can be downloaded from the page https://science.nrao.edu/facilities/alma/site, which also contains a very detailed description of the site characteristics and links to publications in the ALMA memo letter series, and the latter data can be downloaded from http://archive.eso.org/wdb/wdb/eso/meteo_apex/form
Figure 3 shows the temperature, humidity, wind speed, and barometric pressure on Chajnantor as function of time of the year. The southern hemisphere winter (June-August) is characterized by lower temperatures, lower humidity, higher wind speeds, and slightly lower pressure compared to the southern hemisphere summer (December-February) conditions.
The quartile data in the figures are based on median values per each hour. The median filter tends to smooth the appearance. The smoothing of the data affects in particular the plot of the wind; in the raw database measurements there are wind gusts of up to 46 m/s, and sustained wind for more than one hour of up to 32 m/s.

Figure 3: Weather statistics (temperature, humidity, wind speed, and pressure) measured at the APEX weather station. Data have been collected over the years 2006-2010. The blue, green, and red bars show the 1st, 2nd, and 3rd quartile of the data. The raw data have a dump rate of 1 minute. From the raw data, the median value per hour was calculated and these median values were sorted per weeks. The thin cyan line shows the tenth largest value in the database, and the thin purple line shows the tenth lowest value among the median values, per week, respectively.

Figure 4: Diurnal variation of temperature (upper row) and wind speed (lower row) in June (left column) and December (right column) as function of Chilean local time (CLT). Data have been collected over the years 2006-2010. The blue, green, and red bars show the 1st, 2nd, and 3rd quartile of the data. The raw data have a dump rate of 1 minute. From the raw data, the median value per hour was calculated and these median values were sorted per time intervals. The thin cyan line shows the tenth largest value in the database, and the thin purple line shows the tenth lowest value among the median values, per time interval.
The diurnal variation of temperature and wind in a representative winter month (June) and in a representative summer month (December) is shown in Figure 4. Typical night-time temperatures range from -10 to -6 degrees C during winter and -4 to 0 °C during summer. Temperature rises slowly after sunrise, reaching normally around -4 °C during winter time and +4 °C summer time. Extreme night and day temperatures range from a minimum of -20 °C to a maximum of 12 °C, respectively.
During winter, the wind speed at night time is characterized by steady wind 5-7 m/, increasing after sunrise, reaching 6-11 m/s at 12-14 (CLT), after which the wind speed begins to drop slowly. The wind speed during summer looks slightly different, with a minimum of 2-4 m/s at 22-02 (CLT), gradually increasing up to 19 (CLT), when it reaches 8-10 m/s, after which the wind speed drops relatively abruptly. The latter winter speed pattern normally starts in October and continues until March.
PWV and Atmospheric Transmission
At millimeter and submillimeter wavelengths, pressure broadened molecular spectral lines make the atmosphere a natural limitation to the sensitivity and resolution of astronomical observations. Tropospheric water vapor is the principal culprit. The translucent atmosphere both decreases the signal, by attenuating incoming radiation, and increases the noise, by radiating thermally. Furthermore, inhomogeneities in the water vapor distribution cause variations in the electrical path length through the atmosphere. These variations result in phase errors that degrade the sensitivity and resolution of images made with both interferometers and filled aperture telescopes.
Figure 5 shows the precipitable water vapor (PWV) measured by the APEX radiometer as function of the time of the year. This image shows that during more that 50 % of the time between April and December, the PWV is below 1 mm (green quartile), and during the 5 best months (May-September), the PWV is below 0.5 mm for more than 25% of the time (blue quartile). The instrument uptime was in this period 80%. Lack of data indicate that the shutter was closed due to high humidity, and during these periods the pwv is assumed to be 10mm.

Figure 5: The precipitable water vapor, measured by the radiometer at APEX, as a function of the time of the year. Data presented here have been collected over the years 2007-2010. The blue, green, and red bars show the 1st, 2nd, and 3rd quartile of the data.
Figure 5 shows that the 1st, 2nd, and 3rd quartile of the PWV in March is 1.6, 3.3, and 5.2 mm, respectively, and the corresponding quartiles for August is 0.4, 0.65, and 1.05 mm. The transmission plots at these PWVs is shown in Figure 6. This image shows that in March, it is fully possible (from a transparency point of view) to operate in most frequency ranges in the lower frequency ALMA bands, and in August, the upper frequency ALMA bands open up as well.

Figure 6: The zenith atmospheric transmission in March (upper panel) and September (lower panel) represented by the 1st, 2nd, and 3rd quartile of the PWVs in the two months, respectively. The different colored boxes are the ALMA bands 3-10.

Figure 7: The diurnal variation of the PWV in March (upper panel) and August (lower panel).
The PWV also has a diurnal pattern. Taking March and August 2010 as two examples of an (late) Altiplanic month and Southern winter month, respectively, it can be shown (see Figure 7) that the PWV peaks at 19 (CLT) in both winter and summer, but the absolute scale differs; During 50% of the time in March 2010 the PWV was below 1.8 mm, and during August 2010, the PWV was below 0.7 mm 50% of the time. It should however be noted that these numbers vary greatly from year to year.
Phase Fluctuations/Stability at Chajnantor
Tropospheric phase stability was measured directly using two phase monitors (site test interferometers, STI), one built by NRAO and one by ESO, and located in Chajnantor. These observed unmodulated beacons broadcast from geostationary satellites and measure the phase difference between the signals received by two 1.8 m diameter antennas 300 m apart. Because the atmosphere is non-dispersive away from line centers, the results can be scaled to millimeter and submillimeter wavelengths. From the phase time series, the RMS path fluctuations on a 300 m baseline, the power law exponent of the phase structure function, and the velocity at which the turbulent water vapor moves over the array were obtained. The NRAO STI operated almost continuously since May 1995 until August 2005, and the ESO STI from June 1998 until July 2005. The data is analyzed to derive the path fluctuations AT THE ZENITH for a 300m baseline using 10 minutes time bins, to guarantee that the phase screens have had enough time to cross over the STI baseline completely.
The results of both STIs are as follows (fluctuations at zenith for 10 minute bins):
|
Zenith Path Flucts. [µm] per quartiles |
NRAO STI |
ESO STI |
|
75% |
389 |
287 |
|
50% |
194 |
129 |
|
25% |
91 |
48 |
A merged statistical plot of the information obtained with the NRAO STI is as follows:

The plots in the upper row (from left to right) show the monthly median, the comparison of the monthly median as a function of year and the median diurnal variation of the path fluctuation RMS, respectively. There is a clear correlation of increased phase fluctuations with Altiplanic winter and with time of day (larger fluctuations during day time, peaking near local noon).
The plots in the lower row (from left to right) show the cumulative distributions of the fluctuations, the slope of the dependency of the fluctuations with baseline lenght and the crossing time of the STI baseline, respectively. The plots suggest that the fluctuations are never pure Kolmogorov, and that a possible mixture of layers, different layer velocities, etc may be occurring at the AOS.
References:
Otarola A., Holdaway M., Nyman L-E., Radford S.J.E., Butler B. J (2005-02-01), ATMOSPHERIC TRANSPARENCY AT CHAJNANTOR: 1973-2003, ALMA Memo # 512
Neal Evans, John Richer, Seiichi Sakamoto, Christine Wilson, Diego Mardones, Simon Radford, Selby Cull, Robert Lucas (2005-07-03), Site Properties and Stringency, ALMA Memo # 471
Alison Stirling, John Richer, Richard Hills, Adrian Lock (2005-04-05), Turbulence Simulations of Dry and Wet Phase Fluctuations at Chajnantor. Part I: The Daytime Convective Boundary Layer, ALMA Memo # 517
