Update on ALMA Cycle 0 observations
Array Configuration
There were two 16-element array configurations advertised for Early Science in Cycle 0. From September 2011-March 2012 the array was in the "Compact Configuration", with baselines ranging from 18m - 125 m. Starting in April 2012 the array was in the "Extended Configuration", with baselines from 36m - 400 m. Additional antennas have continued to be incorporated into the array and as of August 2012 we have been in a “C+E” configuration, with short baselines typical of the Compact configuration, and long baselines up to the Extended configuration (see Figure 1). As such, we are now scheduling both extended configuration and compact configuration projects. Since early August a number of projects still in the observing queue have had the estimated observing time revised downward, based on the larger collecting area of the current array (although project completion is still judged by achieved rms, not observing time).
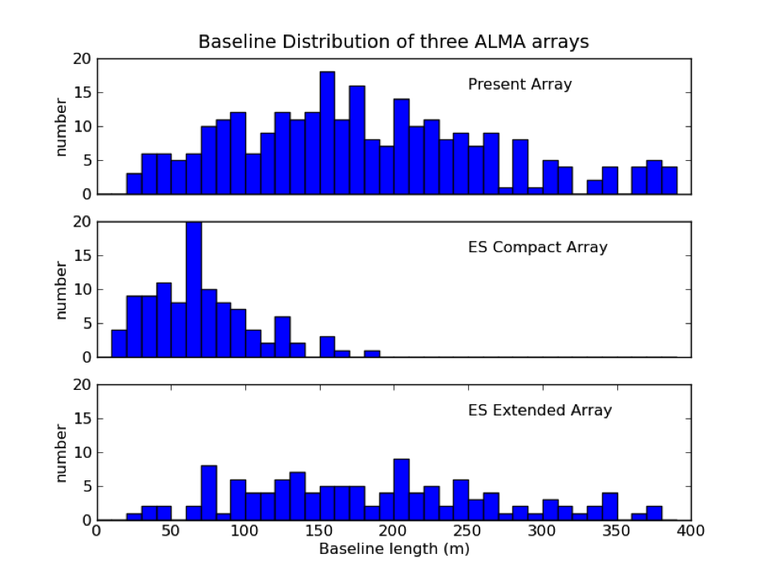
Figure 1: ALMA 12-m array distribution of baselines as of late August 2012 (Nant=23; top), compared to the original "Compact" configuration (Nant=16; middle) and "Extended" configuration (Nant=16; bottom).
Observing Progress
Table 1 shows the current status of observations as of September 15, 2012. Each project consists of one or more Scheduling Blocks (SBs), associated with the science goals of the project, and each SB needs to be executed one or more times to meet the goals of the project. In cycle 0 there are 113 “highest priority” projects, comprising 370 SBs now requiring 748 executions in total (this includes the recent downward revision in the number of executions needed based on the increased collecting area of the C+E array). That an execution passed QA0 (or Quality Assurance Step 0) means that the SB ran completely on the telescope and produced an exportable dataset, that it passed QA0+ means that the execution should be useful for data processing (includes necessary calibrators and spectral windows), and that it passed QA2 means that the science target data passed the quality control assessment after calibration and imaging.
Table 1: Status of Cycle 0 projects and SB executions as of October 5, 2012
|
Priority=Highest |
Projects |
SBs |
Executions |
|
Total Number Needed |
113 |
370 |
749 |
|
Started (passed QA0) |
96 |
278 |
619 |
|
Passed QA0+ |
- |
244 |
574 |
|
Passed QA2 or delivered (partly or completely) |
59 |
182 |
363 |
|
Completed |
25 |
182 |
363 |
|
Completed (%) |
22% |
49% |
48% |
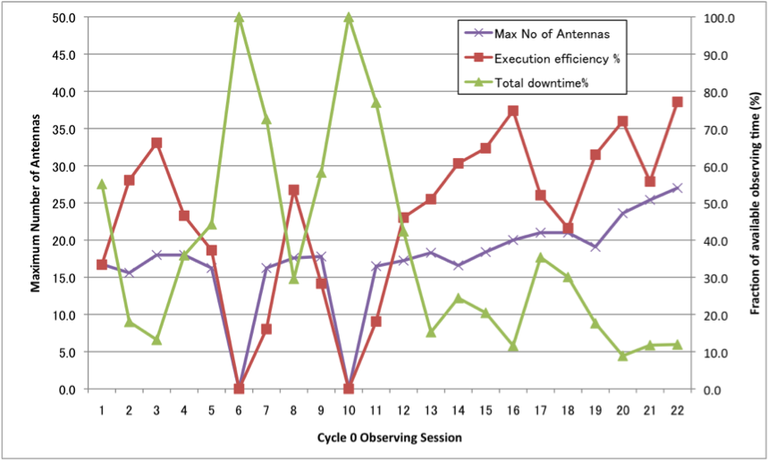
Figure 2: Efficiency Statistics for the 22 ALMA Early Science (ES) observing sessions through August 31, 2012: total downtime (green), execution efficiency (red), and maximum number of antennas used (purple). Execution efficiency is the time spent executing ES schedule blocks (including calibration observations) as a percentage of the total time available for science observing.
Cycle 0 observations are done in blocks of one week of observations every two weeks. A total of 29 observing blocks are planned in Cycle 0 and so far 22 have been completed. Figure 2 shows the observing efficiency (time spent on successful early science executions/total available time), downtime percentage (weather+technical) and maximum number of antennas used per observing block.
Figure 3 shows the cumulative number of SBs for which observations have begun, and the number of SBs that are finished [LB1] (having passed the first level of quality assurance - QA0 – with enough successful executions done to reach the required noise level) as a function of observing block. The purple line is an estimate of how many SBs should have been finished during these observing blocks in order to complete all 113 high priority projects (in total about 370 SBs executed in 29 observing blocks) at the end of Cycle 0. In a good observing night, we successfully obtain ~7 executions, and there are 6 observing nights per session (one night per session is used for calibration and calibration source surveys).
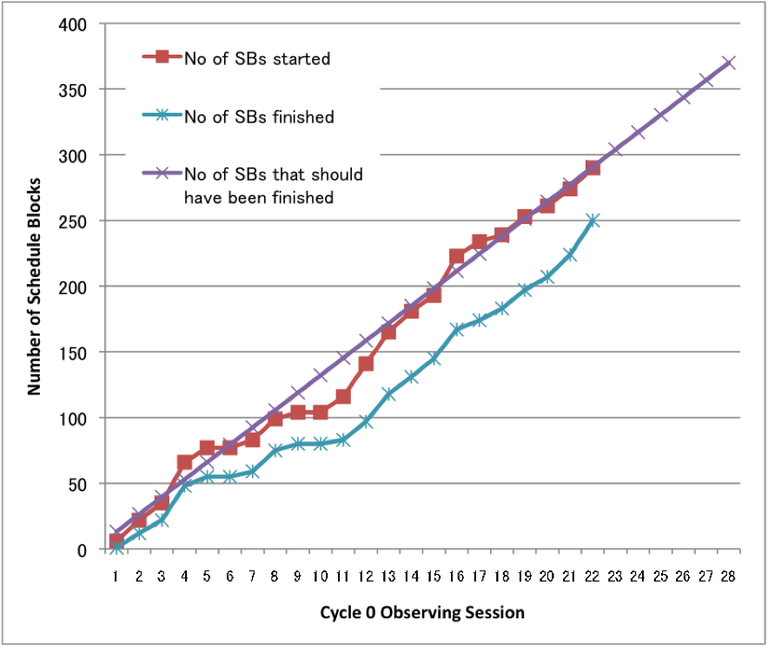
Figure 3: Schedule block progress for the 22 ALMA ES observing sessions through August 31, 2012: SBs started (red) and finished (blue), compared to the rate required to finish all “Highest Priority” SBs (purple).
Remaining Executions
There are three months remaining for Cycle 0 observing with ~6 more observing sessions scheduled. The distribution of the central LST for the remaining executions is given in Figure 4. Red bars indicate the time that is reserved for engineering (9am-4pm local time) for the remaining months: (top to bottom): October, November, and December. [LB2] These months are generally less favorable for high-frequency observing (see Figure 1 in “ALMA Cycle 1 Proposers Guide”). Based on this histogram and the observing progress displayed in Figure2, we anticipate being able to observe a high-fraction of Highest Priority projects, but do not expect to complete all high-frequency projects or all project centered around LST 5 hr and 12 hr. Some “Filler” projects may be observed in under-subscribed LST ranges.
The highest priority for ALMA is the completion of the array. In the coming months, the final quadrants of the baseline correlator are being installed, we are switching over to the permanent power supply and distribution system, new software versions and Cycle 1 observing modes are being tested and validated, Cycle 2 observing capabilities are being commissioned, and new antennas and receiver cartridges continue to be delivered. While completion of the highest priority Cycle 0 projects is very important and we will do what we can to ensure that all PIs receive scientifically valuable datasets, the construction activities will continue to take precedence.
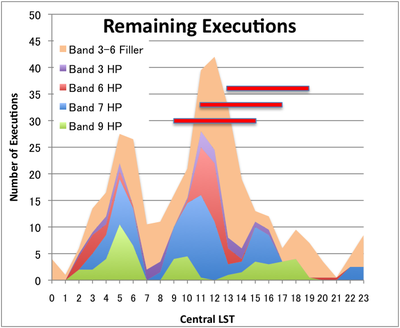
Figure 4: Cumulative LST distribution for remaining Cycle 0 executions as a function of observing band. The red bars show the time reserved for engineering for the remaining observing sessions in (bottom to top): October, November, & December.
Data Reduction
Figure 5 shows the number of SBs that have been processed and approved for delivery or delivered to PIs as function of time. At this early stage of ALMA operations staff at the JAO and the three ARCs are processing the data following a standard data reduction process, conducting quality assurance checks, and packaging the data for delivery to PIs. This process is very time-intensive, and it currently takes on average ~ 7 weeks from the time when execution of an SB is completed to when the dataset passes quality assurance. In addition, problems with the online calibration have prevented the delivery of Band 9 datasets, but this has recently been fixed and these observations are being reprocessed through the online system and will soon be made available to the data reduction teams. These factors lead to the shallow slope of the blue line in Figure 3. A concerted effort is being made by the observatory to close this gap before the end of Cycle 0.
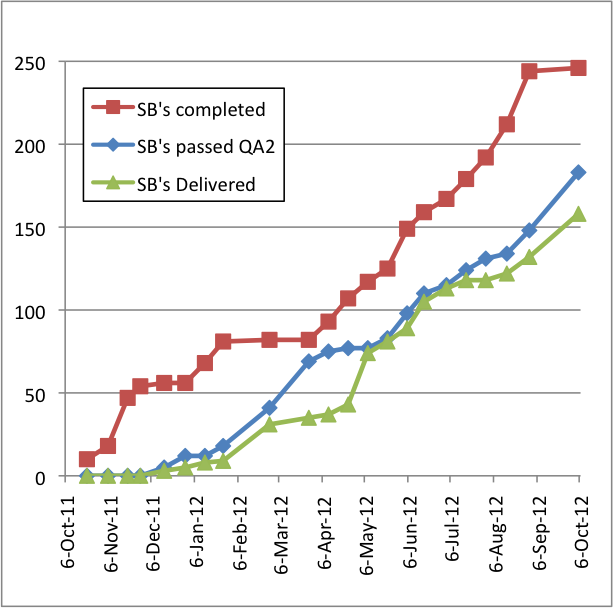
Figure 5: ALMA ES Data processing status. The red curve shows the number of SBs that have been observed the requisite number of times, while the other curves show the number of datasets that have been fully approved for delivery (blue) and delivered to PI’s (green).
The regional ARCs and ARC nodes welcome visits from Cycle 0 investigators to work on their ALMA data products. Visit requests should be submitted using the ALMA helpdesk (help.almascience.org). If you receive assistance from an ARC or ARC node, please include this in the acknowledgements of any paper using the ALMA data. Also please remember to include the standard ALMA acknowledgement given at
http://almascience.org/alma-data.
